
In this investigation, students are studying the relationship between invasive Japanese Barberry plants and the number of ticks found nearby compared to areas where Japanese Barberry is absent.
Instructions / How to do this investigation
PROTOCOL
Materials:
- Tyvek Suits
- Diaper Flannel
- Clothesline cord
- Tree Flagging
- Small vials for tick collection filled with ethanol or rubbing alcohol
- Forceps/tweezers
- PVC pipe – cut to 1m
- Duct tape/clips
- White socks
- Paper/pencil for data collection
Data Collection Methods:
- Identify at least three barberry plants on the property and mark off a 20×20’ quadrat with flagging. The sample area can be adjusted to suit the needs of each individual site.
- Identify at least three areas with native plants on the property and mark off a 20×20’ quadrat with flagging.
- Assemble the materials needed for tick dragging including making the dragging devices.
- Head to barberry and native species locations three times a week.
- Using the dragging device, survey the area, check the sheet after surveying half the quadrat and collect any ticks in a vial. Repeat the process for the second half of the quadrat. The recommended amount of time to stop and check for ticks is every 20m or about every 30 seconds. If you don’t stop to check often enough, ticks you picked up earlier will start to fall off the sheet.
- Make sure the students walk at a very, very slow wedding march pace.
- Once the quadrat has been fully surveyed, label the vial with the quadrat id.
- If the tick drag sheet becomes soiled, change out the sheet before using it again in a survey drag. You can also use a lint roller to remove any seeds/debris to make it easier to see the ticks.
- Go to another quadrat site and repeat steps 5-8.
Data Analysis:
- Once you’ve finished, head back to your classroom and count the number of ticks in each labeled quadrat vial.
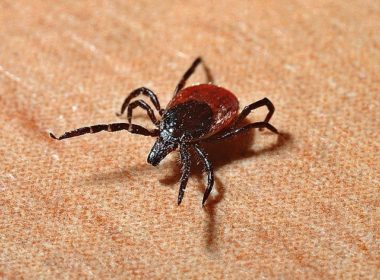
- Identify which tick species you have and the numbers for each type. There are only a few common ones and are generally easy to tell apart using a magnifying glass.
- Upload the data to the WeatherBlur site:
- Tick species and number
- Quadrat label
- Date
- Temperature – try to record the temperature just above the ground where the ticks quest
- Weather conditions: Sunny, Windy, Fog, Raining, Snowing
- Latitude & Longitude for quadrats
Resources:
Comments
Tell us how your data collection/analysis is going