
Please see the instructions (link above) for how you can get involved in this project. There are three types of observations to collect. The first are photographs and videos of sites before, during and after the King Tide on November 15, 9.30am (time will vary depending on location). The second tab is a place to record measurements of a high tide BEFORE the King Tide, and to calculate your locations mean sea level. The third is a place to record the height of the King Tide at your location and record some basic wind and other weather information. Please always consider your safety while being involved in taking measurements for this investigations. Do not venture into inundated water etc. STAY SAFE!
Instructions / How to do this investigation
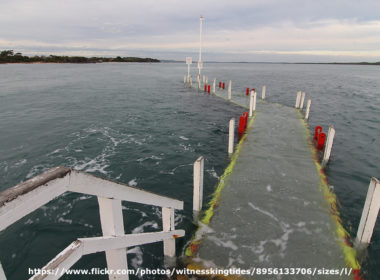
Measuring the local King Tide.
Please always keep your and your students safety in mind when being involved in this project. Do not go into places that water has covered or surf/swell is making it unsafe.
What to do BEFORE the King Tide day
Tides tables provide information about the time and predicted estimated height of high and low tides at a location. These heights are based on the mean tide level – that place in the middle between all the high and all the low tides. So high tides are ABOVE that mean sea level and low tides are BELOW that mean sea level. Often low tides are shown as a negative number to represent ‘below’ the mean sea level.
The frame of reference for tide levels is: positive is up and negative is down. The starting point or “zero” can be Mid-Tide Level (MTL), Mean Sea Level (MSL), or Mean Lower Low Water (MLLW). The zero elevation is called the DATUM. Check to see what your tide table uses.
Tide tables (printed in the newspaper or on calendars) usually report water levels relative to the MLLW datum. This level is assigned a value of zero. Values less than zero are below MLLW (really low low tides) and positive values are positive up to the level of the King Tide. Select a datum to use and be careful to stick with it.
Tide tables provide information at over 100 specific locations on the Maine coast. Your location may be a distance from the published tide location, so you will find the tides are slightly different in terms of timing and elevation. The high tide, for example, may be at its maximum 20-30 mins earlier or later than the published chart for a site 30 kms away.
So if a tide chart says that the predicted height of a tide is 2 meters, then that means that the water level will be 2 meters higher than the datum. If a tide chart says the low tide will be -1 meter, that means it will be 1 meter lower than the datum (see illustration).
You can work out the height of the average sea level at any given place by measuring the height of the ocean from a fixed place, like a wharf or dock, exactly at the time of a high tide. Remember, you can find the estimated time and predicted height of a tide using a tide table, but the exact time for the high tide may be slightly different. Determining the exact time of high tide in your specific location might not be important, but it is good to be prepared to observe water levels ahead of the prediction. Ten to 15 minutes ahead of a prediction is probably sufficient lead time. Water levels do not change very fast around the time of high or low tide.
Please note that the wharf or dock needs to be FIXED and not floating. A float, however, may provide you access to the fixed pilings or piers of a wharf. A float will also provide a good vantage point for photography.
You can measure the distance from the water up to the wharf at the time of high tide and get the height of the wharf (or other fixed part, like a beam) relative to the tidal datum.To do this, you would ADD the tide height from a tide table to the distance measured in the air. This calculation will tell you the height of the wharf above mean tide level or MLLW, depending on which datum you chose.
Example:
The tide chart says that the high tide will be 2 meters MSL. I go at high tide and measure from my wharf down to the surface of the water. The measurement I take is 3 meters. So know I know that my wharf elevation is:
3 meters (my measurement) + 2 meters (how high the tide was predicted on the tide table) = 5 meters MSL.
At my location, mean sea level is 5 meters below the top of the wharf.
If you take measurements at high tide over a number of days and average this number, you will get an more accurate distance to mean sea level. [If you chose to work with the MLLW datum, the same procedure applies and, over a few observations, you will get a good approximation of how high the wharf is over MLLW.]
You should also be aware that local weather conditions (winds and air pressure) can make daily variations to the tides as water can be pushed away from the coast or towards the coast. During large storms we hear this referred to as a ‘storm surge’. And so taking a number of measurements over a number of days in good (not stormy) weather, is ideal.
On and after King Tide day
Once you have established this distance to your tidal datum at you location, you can have students do a few things:
Estimate the height of the King Tide
Estimate, using a tide table, what the distance will be from the the wharf to the surface of the water during the King Tide. Remember, the larger the tide the SMALLER the number. To do this look up the tide chart for November 15 and SUBTRACT the predicted height from your distance to the datum level at your location.
So if the tide is going to be 3 meters, and your average sea level is 5 meters below your wharf, then at the king tide maximum the water level should be just 2 meters below your wharf.
In some locations you may find that the height of the King Tide is GREATER than the distance to your average sea level, and so that calculation predicts that the wharf will be under water during the King Tide!
Measure the King Tide
On the day, go and take measurements down to the surface of the water over a period of time (30 mins) taking a number of measurements – say every 10 mins. You will then know exactly:
- The time the King Tide reached its maximum
- The height above your local datum the King Tide reached.
The field challenge is that the water is not still (waves and currents etc) so getting a distance in the will challenge them. A suggestion is to take to take several measurements and average them.
Record the King Tide
As well as taking measurements, you can also record the effects of the King Tide by taking photos of places where the King Tide has affected roads, beaches, causeways, piers, docks, wharfs. You might find it useful to take some photos before, during and after the event from the exact same location.
Remember that you need a scale in your photos – something that shows the size of the effects. But also remember that photos of students is strongly discouraged.
Here is a great link to how to take photos, provided for another state: http://california.kingtides.net/plan/
Discuss the King Tide
Once you have a measurement, you can then discuss a number of things:
- How did your measurements differ from the predicted measurements?
- What may have affected the tide to make it different? (Weather? What did your school weather station record for the winds and air pressure for that day).
- How could you change your measuring protocols to get a better result?
Comments
Tell us how your data collection/analysis is going