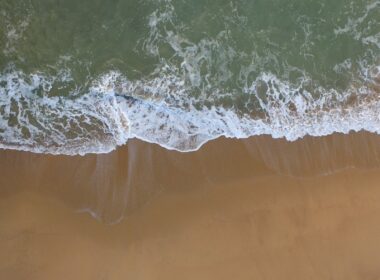
In this investigation, students use Google Earth to assess shoreline erosion on a local marine shoreline.
Instructions / How to do this investigation
Erosion Protocol
- Download Google Earth Pro
- Get familiar with Google Earth by searching for a specific location and playing with the history. Try a different location.
- Go to search at upper left and search your location
- Zoom into the area you want to study. Find endpoints to help guide your mapping. Make sure the area you’re zoomed into is the area you’ll be mapping.
- Make a prediction about how erosion has changed over time at this location. Be sure to record your prediction somewhere.
- Change angle (go into view, reset, tilt)
- Go to the ruler in the upper toolbar and ensure the scale is in feet.
- Click on the year at the bottom left to get the scale of dates on the upper left.
- Choose the earliest year with a useable map – some older maps are too blurry or pixelated to get an accurate measurement.
- Decide how you are going to draw vegetation. You can choose to include sparse vegetation or not. Sparse vegetation means areas where there is not a lot of plant growth or minimal plant growth including small shrubs, bushes, and/or grass.
- Add a path (click path in the ruler window)
- Click on points to create your path for accuracy
- Turn on temporary places.
- Save
- Name it
- Click on Style/Color, Choose color (use 3 for width)
- Press ok
- Choose a new year (we documented every 2 to 3 years) and repeat
- Lines will be saved under temporary places. (Click on the years you want to show on the map)
- Take a screenshot comparing all lines.
- You will want to label the color you used for each year.
Data sheet:
- Predictions
- Outcomes
- Years of known impactful storms
- Years surveyed
- GPS coordinates for the survey location
- Beach geographic information (direction facing, sheltered/open ocean, substrate (sandy, rocky, etc)
- Upload an image of your map


Comments
Tell us how your data collection/analysis is going