
Graphing Air Quality
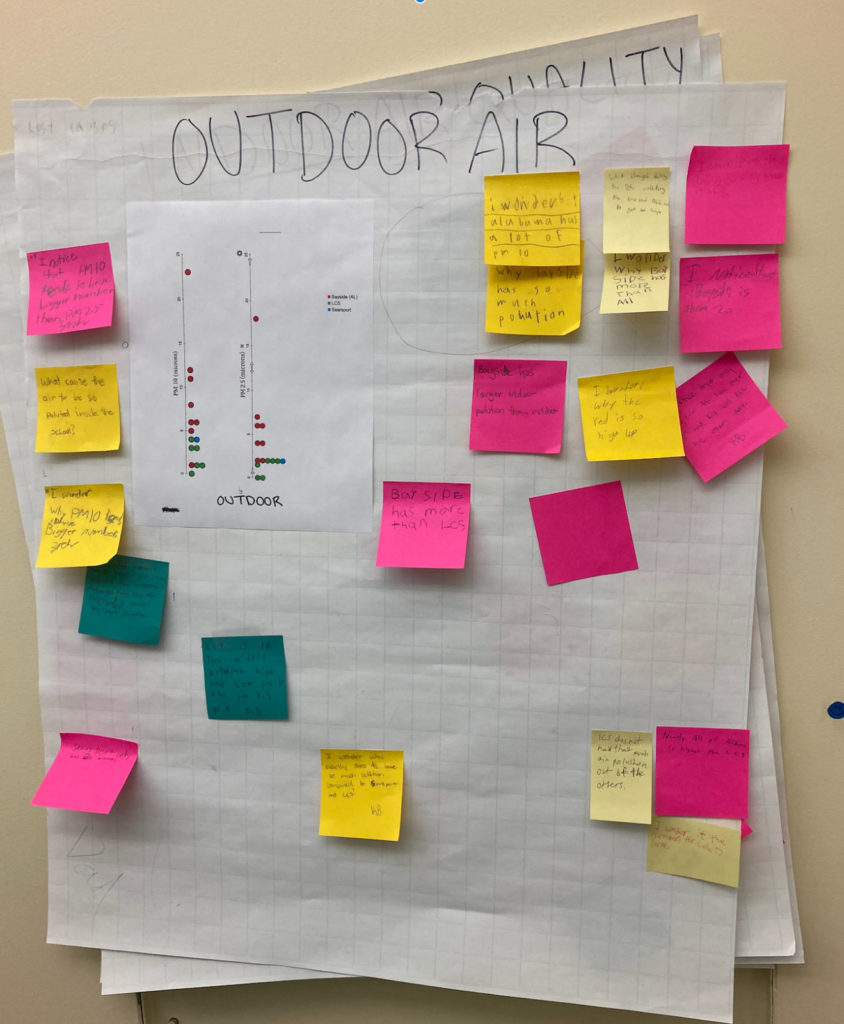
6th grade students at Lincolnville Central School used the air quality data in Tuva to create a graph that answered a question of their choosing. Popular questions included: “How did indoor air quality compare to outdoor air quality at a certain school?”, “What was the relationship between temperature/wind/humidity and PM10?” and “What was the relationship between time of day and PM10?”
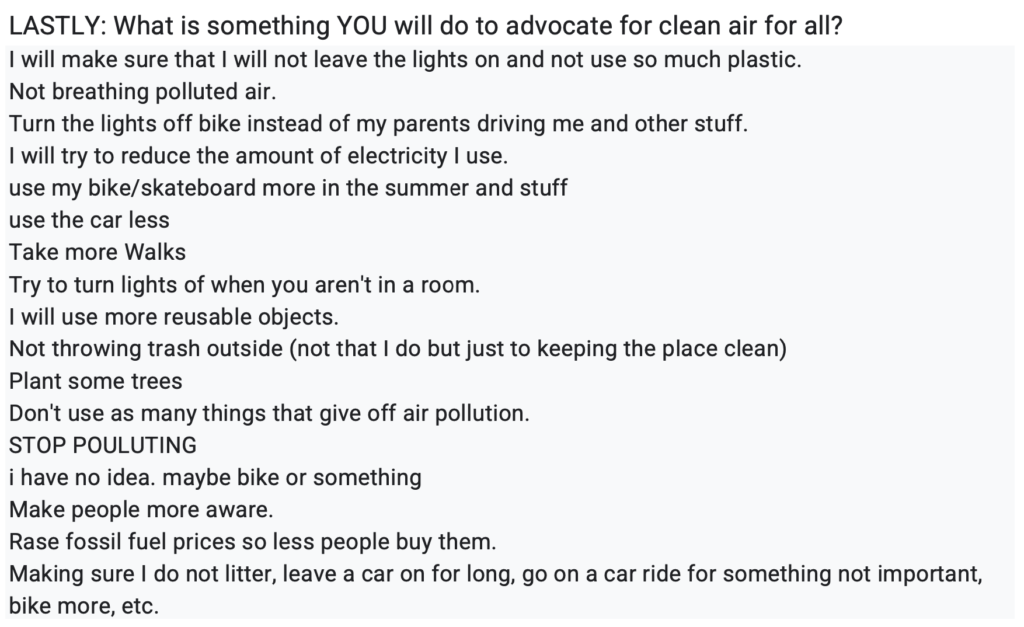
Students then used data from the American Lung Association’s report cards and “State of the Air” report to look more broadly at national air quality data. After comparing different locations across the country, they brainstormed a list of what they could do to advocate for clean air. See list attached.
Do you find this ACT Interesting? How do you think this ACT will help your community? Does this ACT spark ideas for a new investigation?
Provide some feedback to the community.